Kubernetes(K8s) Monitoring with Prometheus/Dynatrace
Kubernetes, also known as K8s, is an open-source container orchestration platform for managing containerized applications in cloud, virtual,
physical, and hybrid environments. It automates certain steps of a container’s lifecycle, such as provisioning, deployment, network creation,
scaling, and load balancing.
Kubernetes and containers optimize the deployment process, eliminating dependencies on the main technology stack. Such independence from the
infrastructure simplifies the regular release management and automation, dynamic scaling, and resource distribution.
K8s flexibility makes the entire development process more reliable and stable.
What is Kubernetes monitoring?
Kubernetes monitoring is a process of collecting and analyzing data from your Kubernetes cluster in order to gain insights into the performance
and health of your applications. It is about keeping a check on the performance and resource utilization of a Kubernetes cluster and its associated
components, including the nodes, pods, and containers. Kubernetes monitoring
aims to ensure the stability and reliability of the applications running in the cluster, detect and resolve performance issues, and identify potential
security risks.
Kubernetes monitoring is an essential part of the container orchestration process. It helps you to gain visibility into the performance of your
applications and identify issues before they become a problem. Kubernetes monitoring tools provide in-depth insights into the performance and
health of your applications, enabling you to identify and address potential issues quickly.
Essential requirements for monitoring
Below are list of requirements for an ideal monitoring solution:
- Full stack visibility
- Process and code management
- Ease of use
- Automatic scalability
- Cloud and on-premises support
- Automatic issue analysis
- User experience monitoring
- Optimal licence cost
Prometheus for Kubernetes
Prometheus is an open-source monitoring system that became one of the first tools used when companies started transitioning to the cloud.
It’s a multidimensional data model with time series identified by metric names and a key-value pair.
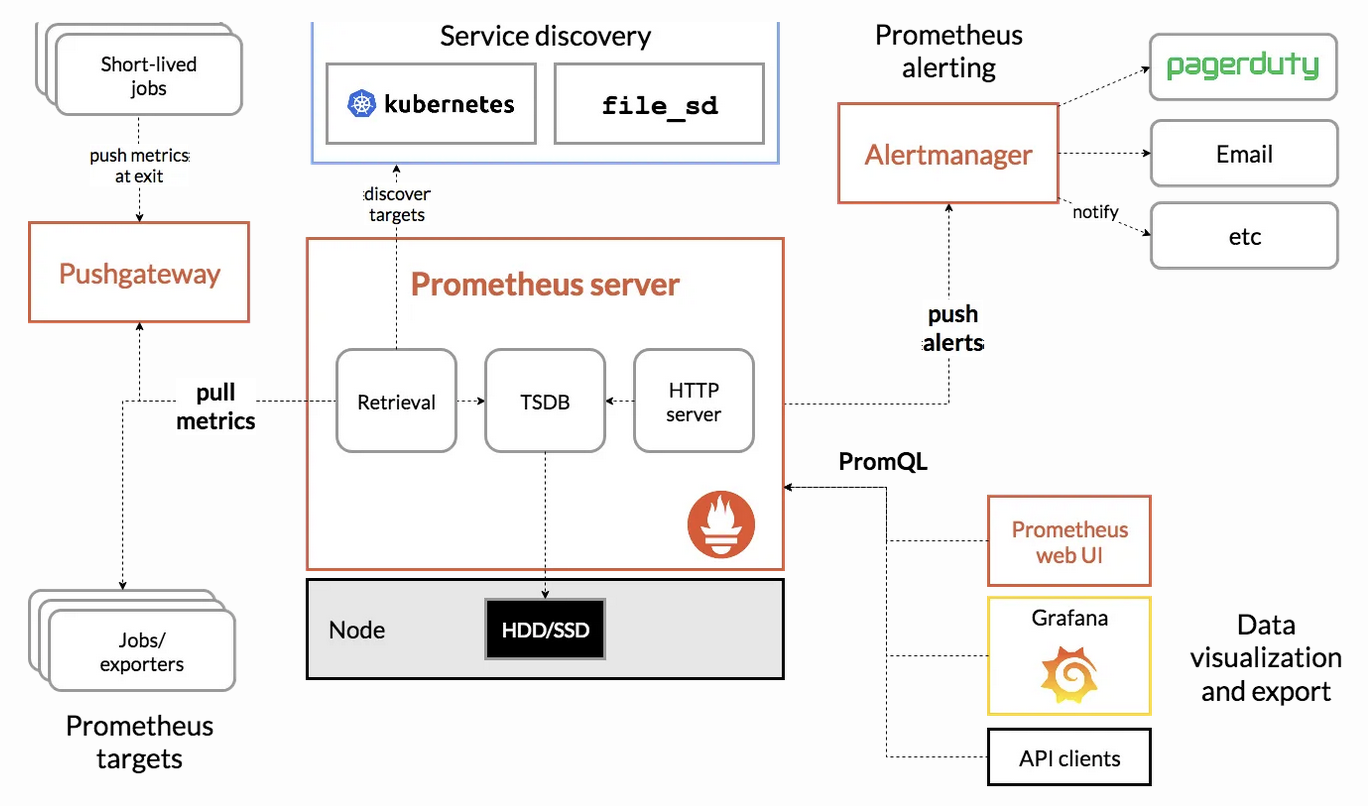
The system works as a pull model – a server sends requests to each node that requires monitoring. Prometheus stores all the collected information
locally and executes rules for this data — aggregates and records new time series from the available data or creates notifications based on the set rules.
Prometheus architecture and some of its ecosystem components:
There are plenty of materials about its integrations on the internet. But the key out-take is that you will need a lot of time and resources to build
a suitable system out of the myriad of extensions and add-ons there are for Prometheus. Moreover, the platform stores data locally, consuming a lot of RAM.
Prometheus is a good tool if you have the resources for its maintenance and development. Like any open-source solution, it requires constant involvement in
extension, upgrading, and scaling.
Dynatrace – a monitoring platform for Kubernetes
Dynatrace is a Davis AI-based monitoring platform that ensures complete infrastructure visibility regardless of its deployment method (cloud, on-premises, or hybrid). It automatically monitors microservice dependencies, application performance, and resource consumption without the need for any configurations and integrations.
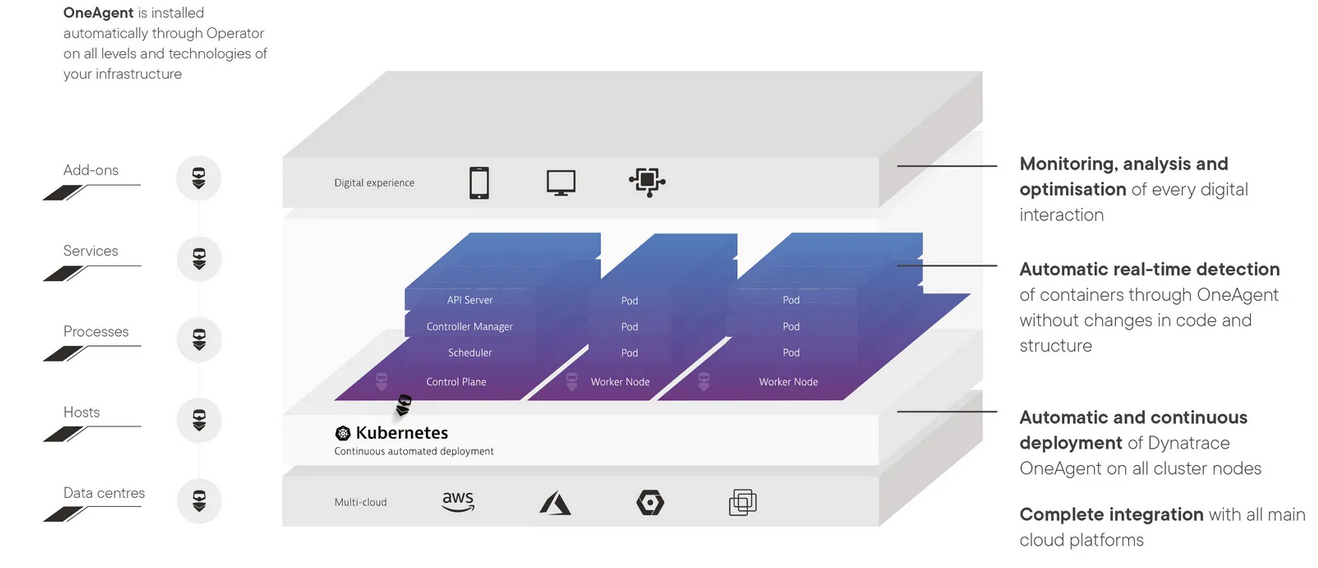
Installation and scaling are automatic. The solution contains all required functionality and doesn’t require additional settings or integrations. It even provides a range of pre-set dashboards that satisfy most case scenarios. You get a detailed analysis of each error down to its cause, saving time and effort for the IT team and allowing your specialists to work on real issues.
Summary and Conclusions
If your company doesn’t have much critical monitoring requirements list, the open-source approach may ensure basic Kubernetes and infrastructure monitoring
needs. Of course, if optimising resources isn’t critical for your business.
On the other hand, if you need a more balanced approach aimed at strengthening and scaling the role of IT in business, it’s better to consider proprietary
solutions and compare the capabilities of each.
Kubernetes monitoring from Dynatrace makes it easy to manage and work with microservices. It saves resources thanks to the AI algorithms that provide real-time
and automatic task resolution.
Author

Sagar Mehta is Atgen Software Solutions Founder and a recognised expert in the field of Intelligent Automation, including Robotic Process Automation, Workload Automation, DevOps, SRE and Advanced Analytics. Sagar advocates a pragmatic approach to Automation, encouraging a policy of using ‘the best tool for the job’.
Prior to co-founding Atgen Software Solutions, Sagar worked in Senior Automation roles, architecting and delivering robust, scalable solutions for many of the world’s biggest banks and working with leading Automation vendors. He developed his first automated solution in 2006 and has continued to deliver robust, scalable and sophisticated Automation ever since.
Sagar is a regular guest speaker and panellist at Automation seminars, conferences and user group events.
Contact
Have a similar problem to solve, let's work together.
Our Address
#107, Tower B, Escon Arena, Zirakpur, Punjab, India - 140603
Email Us
info@atgensoft.com
Call Us
+91-8806666141